
Page 10 - 05
P. 10
ENVIROMENTAL RISK ASSESSMENT OF MARINE 9
INVASIVE SPECIES CARRIED BY BALAST WATER
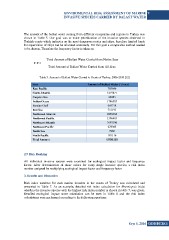
The amount of the ballast water coming from different ecosystems and regions to Turkey was
shown in Table 5. Our goal was to make prioritization of the invasive species observed in
Turkish coasts which indicates us the most dangerous routes and ships, therefore limited funds
for supervision of ships can be allocated accurately. For this goal a comparable method needed
to be chosen. Therefore the frequency factor is taken as;
Total Amount of Ballast Water Carried from Native Seas
F.F = —————————————————————————
Total Amount of Ballast Water Carried from All Seas
Table 5. Amount of Ballast Water Carried to Coasts of Turkey, 2006-2010 [12]
Seas Amount of Ballast Water ( Tones)
East Pacific 785646
South Atlantic 1479877
Caspian Sea 22083
Indian Ocean 1746505
Persian Gulf 669718
Red Sea 751193
Northwest Atlantic 2265604
Northwest Pacific 1396405
Northeast Atlantic 3997390
Northeast Pacific 278385
North Sea 7280
South Pacific 181116
Total Amount
13581202
2.5 Risk Ranking
All individual invasive species were examined for ecological impact factor and frequency
factor. After determination of those values for every single invasive species, a risk index
number assigned by multiplying ecological impact factor and frequency factor
3. Results and Discussion
Risk index numbers for each marine invaders in the coasts of Turkey was calculated and
presented in Table 7. As an example, detailed risk index calculation for Mnemiopsis leidyi
which is the invasive species with the highest risk index number is shown in table 7, was given.
Detailed ecological impact score calculation can be seen in Table 6 and the risk index
calculations were performed according to the following equations.
Sayı 5, 2016 GiDB|DERGi