
Page 37 - 033
P. 37
36 M.S. MERDİVENCİ, A.G. AVCI, B. BARLAS
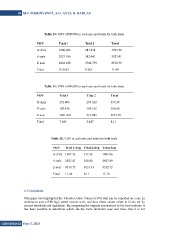
Table 10: VDV of Mti700 in each axis and totals for both trials.
VDV Trial 1 Trial 2 Total
X-Axis 1080.886 541.474 1097.52
Y-axis 2927.196 382.441 2927.41
Z-axis 8438.258 3742.779 8518.75
Total 10.5623 8.265 11.44
Table 11: VDV of Mti200 in each axis and totals for both trials.
VDV Trial 1 Trial 2 Total
X-Axis 272.806 293.322 337.28
Y-axis 107.436 299.165 300.40
Z-axis 3031.841 313.885 3031.93
Total 7.643 5.487 8.11
Table 12: VDV in each axis and totals for both trials.
VDV Trial 1-Avg Trial 2-Avg Total-Avg
X-Axis 1097.52 337.28 1099.96
Y-axis 2927.41 300.40 2927.49
Z-axis 8518.75 3031.93 8552.72
Total 11.44 8.11 12.10
4. Conclusions
This paper has highlighted the Vibration Dose Values (VDV) that can be expected on a car, an
ambulance and a RIB high speed marine craft, and how these values relate to limits set by
current standards and legislation. By comparing the impacts encountered to the boat motions, it
has been possible to determine which are the more dominant axes and show that it is not
GiDB|DERGi Sayı 3, 2015