
Page 33 - 033
P. 33
32 M.S. MERDİVENCİ, A.G. AVCI, B. BARLAS
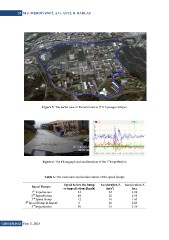
Figure 5: The aerial view of the test route at ITU Ayazaga Campus
Figure 6: The Photograph and accelerations of the 1st Imperfection
Table 6: The maximum acceleration values of the speed bumps
Speed Bumper Speed before the bump Acceleration Z Acceleration Z
1st Imperfection or imperfections [km/h] [m/s2] in g
2nd Imperfection
3rd Speed Bump 34 22 2.24
4th Speed Bump & Imperf. 48 25 2.55
5th Imperfection 12 16 1.63
9 20 2.04
50 35 3.56
GiDB|DERGi Sayı 3, 2015