
Page 30 - 033
P. 30
EXPERIMENTAL INVESTIGATIONS OF 29
ACCELERATIONS AND VIBRATIONS ON VEHICLES AND BOATS
During the trial, the peak acceleration magnitude for the Z axis was 14.79 m/s2 - 1.508 g, while
its rms value was 9.797 m/s2. While passing through the 1st speed bump, the maximum
acceleration is 1.23 g which is 12.1 m/s2. The photograph and the real time accelerations on the
1st Speed Bump is given in Figure 6. The average speed was 20.5 km/h, the average speed
while moving was 23.4 km/h, the minimum speed was 0.2 km/h and the maximum speed was
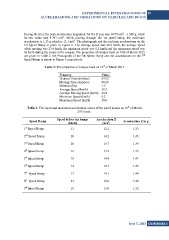
56 km/h during the cruise in the campus. The properties of campus track on 10th of March 2015
are given in Table 2, the Photograph of the 7th Speed Bump and the accelerations on the 7th
Speed Bump is shown in Figure 3 respectively.
Table 2: The properties of campus track on 10th of March 2015
Property Value
Elapsed Time (min/sec) 09:32
Moving Time (min/sec) 08:20
Distance (km) 3.3
Average Speed (km/h) 20.5
Average Moving Speed (km/h) 23.4
Minimum Speed (km/h) 0.2
Maximum Speed (km/h) 56.0
Table 3: The speed and maximum acceleration values of the speed bumps on 10th of March
2015 track.
Speed Bump Speed before the bump Acceleration Z Acceleration Z in g
1st Speed Bump [km/h] [m/s2] 1.23
2nd Speed Bump 13 12.1 1.45
3rd Speed Bump 20 14.2 1.39
4th Speed Bump 20 13.7 1.35
5th Speed Bump 16 13.3 1.47
6th Speed Bump 18 14.4 1.29
7th Speed Bump 14 12.7 1.44
8th Speed Bump 17 14.1 1.28
9th Speed Bump 21 12.6 1.32
10 13.0
Sayı 3, 2015 GiDB|DERGi