
Page 31 - 033
P. 31
30 M.S. MERDİVENCİ, A.G. AVCI, B. BARLAS
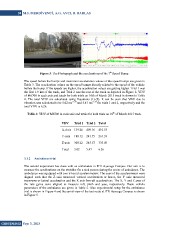
Figure 3: The Photograph and the accelerations of the 7th Speed Bump.
The speed before the bumps and maximum acceleration values of the speed bumps are given in
Table 3. The acceleration values on the speed bumps directly related to the speed of the vehicle
before the bump. If the speeds are higher, the acceleration values are getting higher. Trial 1 was
the first 1.9 km of the track, and Trial 2 was the rest of the track as depicted in Figure 2. VDV
of Mti700 in each axis and totals for both trials on 10th of March 2015 track is shown in Table
4. The total VDV are calculated using Equations (1)-(3). It can be seen that VDV due to
vibration was calculated to be 5.02 ms-1.75 and 5.47 ms-1.75 for trials 1 and 2, respectively and the
total VDV is 6.26.
Table 4: VDV of Mti700 in each axis and totals for both trials on 10th of March 2015 track.
VDV Trial 1 Trial 2 Total
X-Axis 139.26 409.16 410.53
Y-axis 188.12 241.75 261.39
Z-axis 308.22 245.67 335.49
Total 5.02 5.47 6.26
3.1.2 Ambulance trial
The second experiment has done with an ambulance in ITU Ayazaga Campus. Our aim is to
measure the accelerations on the stretcher for a sick person during the cruise of ambulance. The
ambulance was equipped with two tri-axial accelerometers. The axes of the accelerometer were
aligned such that the Z axis measured vertical acceleration or heave, the Y axis measured
transverse or lateral acceleration and the X axis fore-aft accelerations. The X, Y and Z axes of
the rate gyros were aligned to measure roll, pitch and yaw, respectively. Basic vehicle
parameters of the ambulance are given in Table 5. Also experimental setup for the ambulance
trial is shown in Figure 4 and the aerial view of the test route at ITU Ayazaga Campus is shown
in Figure 5.
GiDB|DERGi Sayı 3, 2015