
Page 33 - Sayı-08
P. 33
RISK ASSESSMENT OF UNDERWATER GLIDERS USING 31
UNCERTAINTY ANALYSIS AND FAULT TOLERANT CONTROL
The flow charts are made to see how the mechanisms should work. Now it is needed to do an
importance ranking in all of those errors and insert some redundant hardware or software for the
ones with most benefit/cost ratio. Benefit/cost ratio is our limiting point here as there may be
numerous improvements for each sub-system making design stage a lot longer.
It is clear that in a glider an emergency mother board and battery pack is required as redundant
hardware. What is harder to determine is that what improvement can be made to high RPN motor
and sensory breakdowns. To give an example to let’s take pitch control system as in the flow chart
above. If the shaft on weight transfer unit gets jammed the pitch motion will stop. The first mission
of a fault-tolerant control is finding and identifying the faults that are present (Blanke et al., 2006).
So it should be found that if fault is there. By taking data from the gyro we can determine whether
center of gravity shifted enough or not. Of course there can be little disruption on the measured
pitch angle but by taking data every sampling time for brief time steps, it is possible to pick the
error that is important to us. To detect the error, we can use a simple formulation as follows:
() = 1 ∑0=+50(() − ())2 (2)
5
Where () is signal and also pitch angle of the vehicle and () is reference pitch angle; if
e(k) > λ (fault limit) then there is an fault. The extend of the fault can be found by using fault
identification networks like SOM, CMAC or ICMAC and the output from there gives us
parameters of degree of fault. For our case it can be a “c” parameter where:
c=1.0 for normal state
c=0.66 for jammed state where weight movement in unit time on
shaft is between full value and half value.
c=0.33 for jammed state where weight movement in unit time on
shaft is between half value and zero.
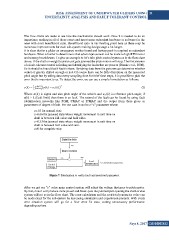
c=0 for complete stop
Figure 7. Mechanism to verify fault and restricted parameter.
After we got our “c” value main control system will adjust the voltage that goes to pitch motor.
By that, motor will produce more power and break-pass the jammed part opening the shaft or else
system will act as in the flow chart. The error calculation and the restricted parameter value can
be made exact for the sub-system by increasing simulation and experiment amounts. With every
error situation system will go for a finer error fix state, cutting unnecessary performance
degrading actions.
Sayı 8, 2017 GiDB|DERGi